Welcome!
I’m a Stern MBA and top-tier strategy consultant with a background in engineering and financial services. I created this site to turn the “black box” of MBA admissions into something more transparent and strategic. Happy researching!
-MBA Data Guru
Featured Article
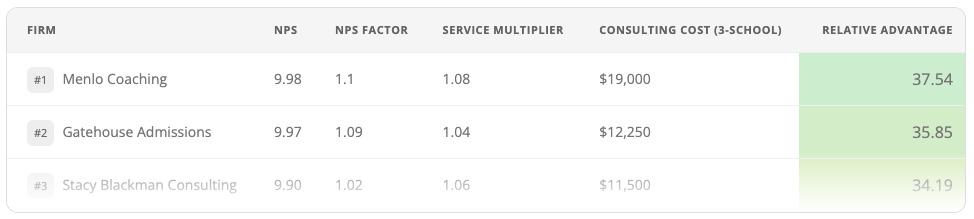
Maximizing Your M7 ROI: Scoring the Best MBA Admissions Consultants
We analyzed verified performance data and service depth to identify the MBA admissions consultants who actually move the needle on your lifetime earnings.
Our Methodology: The MBA Data Guru Relative Advantage Score
- Expected ROI: Grounded in Payscale’s 20-year earnings data for M7 graduates.
- NPS Factor: Derived from verified client satisfaction scores, rewarding firms that consistently over-deliver.
- Service Multiplier: A 5-point audit of coach attention, process coverage, and “embedded extras” like in-house test prep.
- Consulting Cost: We factor in the price of a 3-school package to ensure premium fees are justified by proportional results.
Further Reading
Admissions Data & Probability
This section leverages quantitative analysis to help applicants understand their statistical chances of admission based on their academic and professional background.
- MBA Interview Probability by GMAT and GPA
- MBA Acceptance Rate by Undergraduate Major
- Low GPA MBA Acceptance Rate Analysis
- Military MBA Acceptance Rate Analysis
- MBA Acceptance Rate by Country
Interview Prep & Waitlist Management
Once the application is in, the focus shifts to the final hurdles. This block highlights resources for conversion from “applicant” to “admitted student.”
- MBA Interview Acceptance Rate Rankings
- HBS Interview Questions and Preparation
- Wharton MBA Interview Questions and Preparation
- MBA Waitlist Acceptance Rate Analysis & Rankings
- MBA Interview Acceptance Rate by GMAT and GPA
Application Strategy & Timeline
These articles provide high-level guidance on building a portfolio and choosing the right time and volume for applications.